
Visualizing 49,000 Shopify products in 3D space: a bi-encoder reranker, contrastive learning, and WebGL.
A few weeks ago, Shopify released a product taxonomy benchmark dataset on HuggingFace with real product data from real merchants, curated for benchmarking category classification models. As someone who recently left Shopify, I found this timing a bit amusing - during my time there, I worked primarily on bot detection and cart APIs, never touching product taxonomy. So naturally, I decided to build something with it.
TL;DR
The result is an interactive 3D visualization web app where ~49K products float through space as points, organized by semantic similarity. Category centroids appear as "stars," and you can explore neighborhoods, search products, and discover where brands sit within this universe of products.
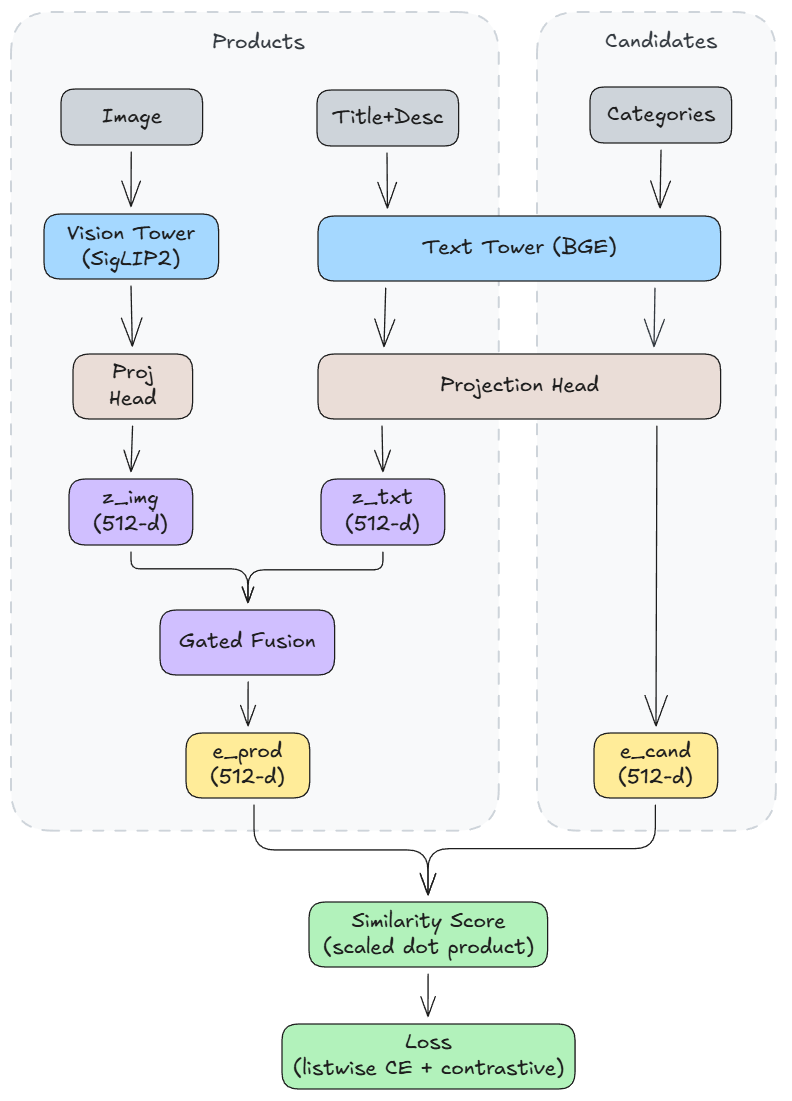
Under the hood, the model architecture producing the embeddings behind the visualization is a two-tower bi-encoder reranker that learns stable, global product representations suitable for downstream tasks beyond just classification. (github repo)
The web app is built with React, Three.js, and WebGL, served via Cloudflare Pages with static assets on R2.
The Data
The dataset (Apache 2.0 license) contains real e-commerce products with text descriptions, images, candidate categories, and ground truth labels.
39K training and 10K test examples
~10K unique hierarchical categories (e.g. Toys & Games > Toys > Play Vehicles > Toy Airplanes)
The pre-computed candidate categories caught my eye - they allow for a reranking formulation rather than pure classification. This forces the model to learn fine-grained category distinctions while also being far more compute-efficient (and hobbyist-friendly) since we only score a small set of candidates (~9) instead of all 10K.
Architecture: Bi-encoder Reranker
Full code here: repo
The core decision was to use a bi-encoder (two-tower) architecture rather than a cross-encoder.
Cross-encoders concatenate product and category inputs, passing them through a single transformer. They're more accurate for reranking, but produce task-specific embeddings that don't generalize well.
Bi-encoders encode products and categories separately, then compute similarity via dot product. These embeddings are reusable and capture global structure.
For my specific use case (global visualization), stable embeddings that capture global structure are more important than reranking accuracy.
Base Models
Vision: SigLIP2 ViT-B (google/siglip2-base-patch16-256). SIGLIP2 is trained with a contrastive objective, producing well-normalized embeddings. Smallest model size keeps me within free-tier compute.
Text: BGE v1.5 base (BAAI/bge-base-en-v1.5). BGE is designed for retrieval and reranking tasks and produces embeddings optimized for semantic similarity. The base model size keeps inference fast and compute low.
Both towers are initialized from pretrained checkpoints, then fine-tuned with LoRA to adapt to the product taxonomy domain.
Projection Heads
Each tower outputs embeddings in its native dimension, that are then projected to a shared 512-d space.
LayerNorm standardizes tower output distributions, which stabilizes training especially when towers are frozen.
The 1024-d hidden layer provides extra capacity for learning richer mappings into the shared space.
GELU adds non-linearity, improving expressiveness.
The final Linear(512) maps both towers into the same 512-d.
L2 normalization scales the 512-d vector to unit length, so cosine similarity=dot product, which simplifies the loss computation and keeps embeddings on the unit hypersphere (useful for visualization and clustering).
Gated Fusion
I used a gated fusion mechanism to learn modality weights:
This lets the model weight modalities per feature dimension and emphasize text for certain products vs images for others.
Training Stages
Training happens in three stages:
Stage 0: Train projections and fusion only. Both towers are frozen (LoRA adapters are applied upfront but also frozen). This establishes the shared embedding space geometry.
Stage 1: Unfreeze text tower LoRA (r=8, alpha=16). Text is often more informative for category disambiguation, so we adapt it first. Targets linear layers matching attention-related name patterns (query, key, value, dense).
Stage 2: Unfreeze vision tower LoRA (r=4, alpha=8). Vision gets a smaller rank because images are less directly tied to category semantics, but still useful for disambiguation. Targets linear layers matching patterns (q_proj, k_proj, v_proj, out_proj, o_proj).
LoRA instead of full fine-tuning is another “stay in free-tier” decision. LoRA adds a tiny fraction of trainable parameters compared to full fine-tuning, while achieving most of the adaptation benefit.
Loss: Listwise + Contrastive
The primary loss is listwise softmax (cross-entropy over candidate scores). For each product, we have a list of candidate categories with one ground truth. The model learns to rank the correct category highest.
The secondary loss is multi-positive InfoNCE with a cross-batch queue, for contrastive regularization. This helps shape global geometry, so neighborhoods remain meaningful for visualization.
The cross-batch queue (inspired by MoCo) stores embeddings from previous batches. This provides:
1. More negatives: Instead of comparing against just the current batch (16 examples), we add ~2000 examples from the queue, improving the contrastive signal.
2. Global structure: By mixing embeddings across batches, the model learns global relationships, not just local batch structure.
Results
These are reranking metrics over the provided candidate set (~9 per product).
After 6 epochs total (2 per stage), the model achieves:
Acc@1: 48.0% | Acc@3: 77.9% | Acc@5: 89.6%
MRR: 0.653
These numbers aren't state-of-the-art, but they're reasonable given the compute constraints (free Colab T4) and the focus on embedding quality over raw accuracy.
Most importantly, the embeddings exhibit good global structure: products cluster by category, and visually the neighborhoods make sense.
Visualization: UMAP + WebGL
The embeddings live in 512 dimensions. To visualize them, I reduced to 3D using UMAP.
Parameters:
n_neighbors=30: Balances local vs global structure.
min_dist=0.05: Allow points to pack together densely.
metric="cosine": Since embeddings are L2-normalized, cosine distance matches ranking similarity.
I used PCA to reduce to 64-d first, to speed up nearest-neighbor search and remove noise before UMAP.
The 3D coordinates are rendered in a WebGL scene using Three.js. The app is built with Next.js and deployed on Cloudflare Pages, with static assets (embeddings, thumbnails) served from Cloudflare R2.
Demo: Category Exploration
Products appear as points with a custom shader that adds a glow effect. Depth-2 Category centroids are rendered as larger "stars" colored by top-level category. The scene supports pan, zoom, rotation, hover tooltips, click selection, and search/filtering.
Here we are hovering over the “Electronics > Audio” category star, bringing up the tooltip.
Here we’ve clicked the star to bring up “gravity lines” to member products, as well as a sidebar showing nearest and farthest products (based on Euclidean distance in UMAP 3D space). We’re also hovering over product that’s “far” from the centroid - a suction cup mount for paddle/surfboards.
Clicking the suction cup mount product shows us the image thumbnail as well as full description text - looking at these, it’s clear to see why the model thinks it’s “far” from the “Electronics > Audio” category. Hovering over neighboring products, we see a lot of “watersports” and “mounts” represented.