
As an actuary who’s finally finished with FSA exams, I suddenly found myself with more free time than I’ve had in six years. After spending my first week of freedom scrolling aimlessly through Netflix menus, I decided it was time to start being more productive (marginally).
So, I present to you my inaugural post in a blog dedicated to applying machine learning to answer life’s most mundane questions.
THE QUESTION
For my first project, I’m starting with good ol’ sportsball: Which current NBA players (who have never been All-Stars) will become first-time All-Stars next season?
THE RESULTS
I’m not completely happy with the model’s performance yet, but I couldn’t wait to put this post up. Model recall averages 45% across the past 10 seasons when testing. Precision is at 39%.
Click through the dashboard below to see how the model performed in past seasons!
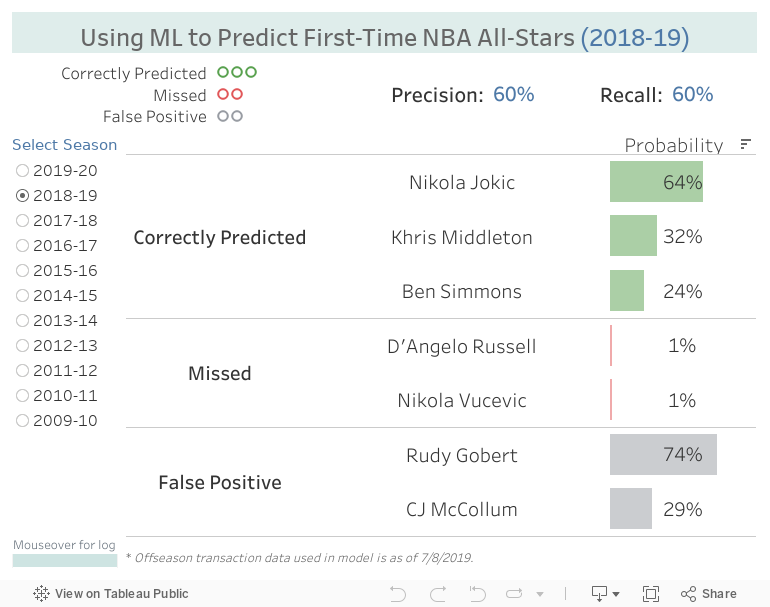
A few thoughts on next year’s predictions:
The model loves Rudy Gobert and has predicted him to be an All-Star since the 2017-18 season. His advanced stats are great - consistently near the top of the league in WS, TS%, VORP, the list goes on - and the Jazz have been playoff regulars. If I were a Jazz fan, I’d be up in arms.
Pascal Siakam makes sense - showing up in the finals probably boosted his household recognition, and a lot of the talent in the East has migrated West this offseason.
I’ll admit I had no idea who John Collins was until he showed up in the predictions (apparently he was a 20/10 guy on the Hawks last year). If anyone was going to be an All-Star on the Hawks, I would have guessed Trae Young, but the advanced stats actually favor Collins. Time will tell...
That was the TL;DR - read on for details if you can stomach them. If not...turn back now!
THE MODEL
I used a gradient boosting decision tree classifier - basically just bunch of decision trees that iteratively minimize the loss of the prior tree.
Parameter Tuning
Parameter tuning results are summarized below. I ended up choosing the 20/0.1/5/30 model with the highest F-score - but there’s definitely more work to do here.

Feature Importance
Variables with top 20 feature importance scores (how useful each feature was in the construction of the boosted trees in the model) are plotted below.
A few things that I found interesting:
Advanced stats were weighted heavily (PER, WS, BPM, etc), more so than typical counting stats.
Google trends ranked 4th, which I consider a personal win since I spent way too much time figuring out how to scrape them.
Playoff minutes/game (P_M_per_G) were an important indicator - seems like lesser known players who show up on the biggest stage really help their All-Star chances next year.
Definitely wasn’t expecting free throws (FT_per_G) to be the most important feature. Maybe an indicator of referee respect, which translates to star power?

THE DATA
Data, sources, and rationale.
Player Data
For the bread & butter of this analysis, I scraped regular season and playoff stats spanning the 1999 - 2019 NBA seasons from www.basketball-reference.com (per game, per 36 minutes, per 100 possessions and advanced statistics).
I also pulled in each player's age, number of years played, primary position, and cumulative awards through each season (DPOY, ROY, MIP, 6MOY). I didn't include All-NBA and MVP, since those players should have long since reached All-Star level.
Team Data
Anecdotally, teams with more wins have more All-Stars so I included team win percentage in the dataset. I normalized wins to be relative to the respective conference average, since All-Stars are selected in equal numbers for each conference.
To represent media market size, I pulled in the count of TV households by Designated Media Market (DMA) from Nielsen's annual DMA rankings report and mapped DMA to NBA city.
Offseason Transactions
I scraped www.prosportstransactions.com for offseason transactions. Using this data, I mapped players to their teams for next season (as of the last recorded offseason transaction).
I also calculated a "net opportunity score" for each team based on the minutes, points, rebounds and assists for players added or lost in the offseason. For example, when the Clippers traded Chris Paul before the 2017-18 season, his 31 minutes and 18 PPG needed to be replaced, potentially by an almost-All-Star taking the next step.
Google Trends
To measure the “hype” factor, I pulled Google search trends for the search term “Player Name All Star” from 2004 - present. I tried using “Player Name” alone at first, but ran into issues with generic names like Mike Scott (Atlanta Hawks, also The Office) coming back with misleadingly high values.